Beyond the VIX: Modern Market Risk Explained
The Rise and Fall of Wall Street's Fear Gauge
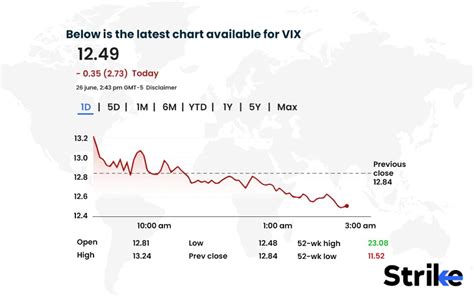
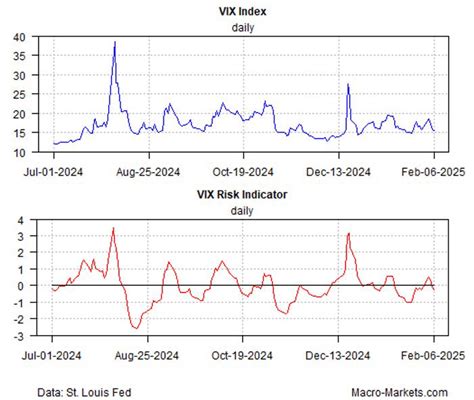
For decades, the CBOE Volatility Index (VIX) reigned as the undisputed "fear gauge" of financial markets. Traders and investors obsessively tracked its fluctuations to gauge market sentiment and predict turbulence. Yet in today's complex financial ecosystem, relying solely on this single-metric indicator has become not just insufficient, but potentially dangerous.
Why the VIX Is Losing Its Edge
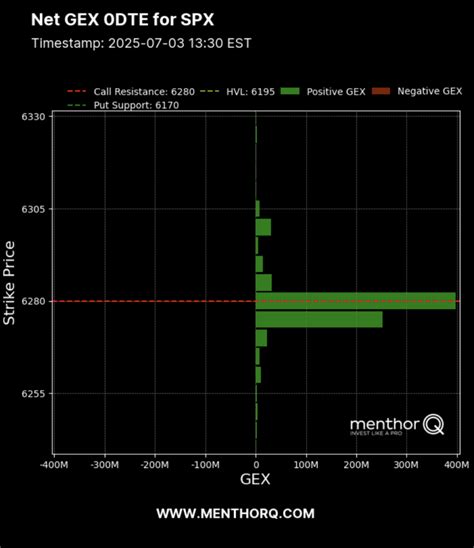
Two critical structural shifts have fundamentally altered the VIX's predictive power. First, the rise of 0DTE (Zero Days to Expiration) options has created a "Gamma Suppression" effect. Institutional hedging now happens intraday through these short-term instruments, causing market makers to dampen volatility in ways that bypass the VIX's 23-37-day calculation window. According to research by Bandi et al. (2023), this masks underlying risk even during fragile market phases.
"When a measure becomes a target, it ceases to be a good measure." - Goodhart's Law
Second, Goodhart's Law has taken hold. With algorithmic volatility-targeting strategies and risk-parity funds using the VIX as mechanical deleveraging triggers, market participants now have strong incentives to suppress implied volatility through short-volatility strategies. This creates artificial calm that obscures genuine risk.
Introducing the Macro Risk Trinity
To navigate this complexity, financial analysts have developed the Macro Risk Trinity model—a multivariate approach analyzing three core pillars of the financial system: Rates, Credit, and Equity. This framework draws from established financial theories:
- Volatility Spillover Theory: Research by Choi et al. (2022) shows macroeconomic shocks typically originate in Treasury markets, not equities. The MOVE Index ("VIX for Bonds") serves as a leading indicator for equity distress.
- Structural Credit Models: Based on Merton's (1974) framework, corporate bond spreads (OAS) reflect balance-sheet fundamentals. When VIX is low but OAS widens, this divergence signals impending equity repricing.
- Knightian Uncertainty: The VVIX (Volatility of Volatility) detects demand for tail-risk protection. A rising VVIX alongside low VIX indicates "smart money" buying crash protection despite calm surface conditions.
Decoding Market Regimes
Using Dual Z-Score normalization to standardize disparate metrics, the model visualizes market regimes through color-coded backgrounds:
- Systemic Shock (Red): Credit spreads and equity volatility spike simultaneously (>2.0 Sigma), indicating liquidity crunch.
- Macro Risk/Rates Shock (Yellow): MOVE index panics while equities remain calm, signaling policy or inflation risks.
- Credit Stress (Maroon): The "Silent Killer" - widening OAS with suppressed VIX signals economic deterioration masked by market complacency.
- Structural Fragility (Purple): Low VIX + rising VVIX indicates excessive leverage and imminent volatility spikes.
- Bull Cycle (Green): Stable credit spreads allow rallies despite equity downturns, indicating technical rather than fundamental sell-offs.
The Limits of Quantitative Modeling
While academically rigorous, the model isn't infallible. Its Z-score approach assumes mean reversion, and calibrating lookback periods (63/252 days) risks overfitting to past cycles. Markets are adaptive systems—correlations can break due to fiscal interventions or new derivatives. The Trinity serves as a compass, not an autopilot.
As markets evolve, so must our tools. The Macro Risk Trinity represents a crucial step toward more sophisticated risk assessment, acknowledging that in today's interconnected financial world, true market pulse requires listening to multiple signals, not just one.
Share this article
Michael Chen
Business and finance reporter specializing in market analysis, startups, and economic trends. MBA from Harvard Business School.